Process Flow Chart
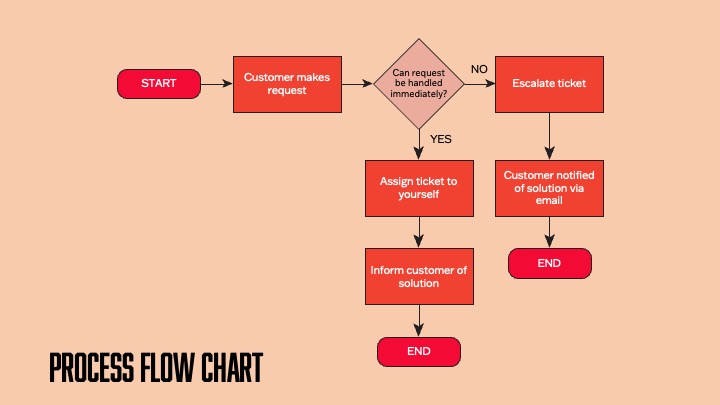
The Process Flow Chart helps visualize the tasks and decisions that make up a process. It lists each task and decision involved in the order that they occur, step-by-step, describing the process from start to finish. Each task is represented by a rectangle and arrows indicate the direction of the flow. Decisions that are part of the process are represented in the form of a diamond with two branching arrows: one for “yes” and one for “no”.
Fishbone Diagram
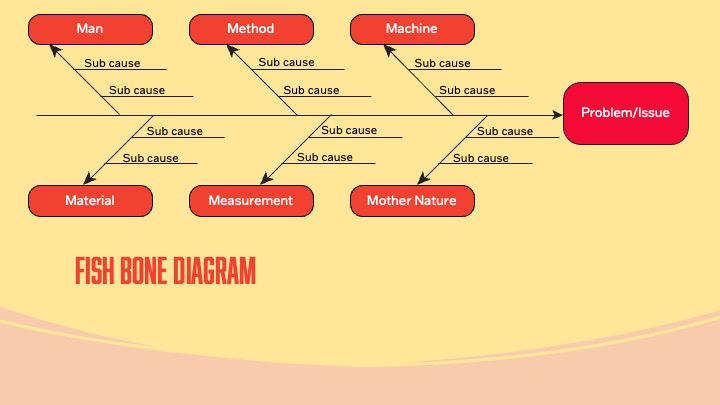
Sometimes we think we have found the cause of a problem or issue but what we are looking at is actually only a symptom. The Fishbone Analysis Tool can be used to identify multiple causes, better understand what is actually happening, and get to the root of the problem.
Causes can be categorized as man, method, machine, material, measurement, or environment. In the diagram, write the categories as branches from the main arrow. Brainstorm possible causes of the problem and list each cause as a branch from the appropriate category. (Causes can be written under more than one category if applicable.)
The 5 Why’s
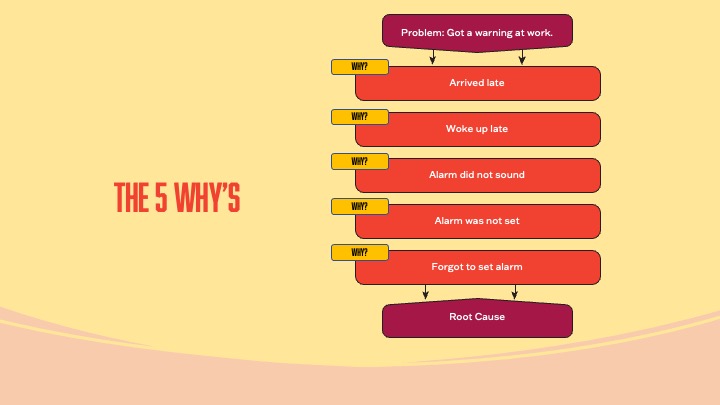
The 5 Why’s are an analysis tool that breaks down a problem by providing an in-depth analysis of its possible causes. Simply put, it can help discover the root cause or “what is actually happening”. Write the problem at the top and then begin by asking “Why is this problem/issue occurring?” For each problem, ask “why” a total of 5 times until the root cause has been identified.